PCNVBrowser
1. Overview of PCNVBrowser
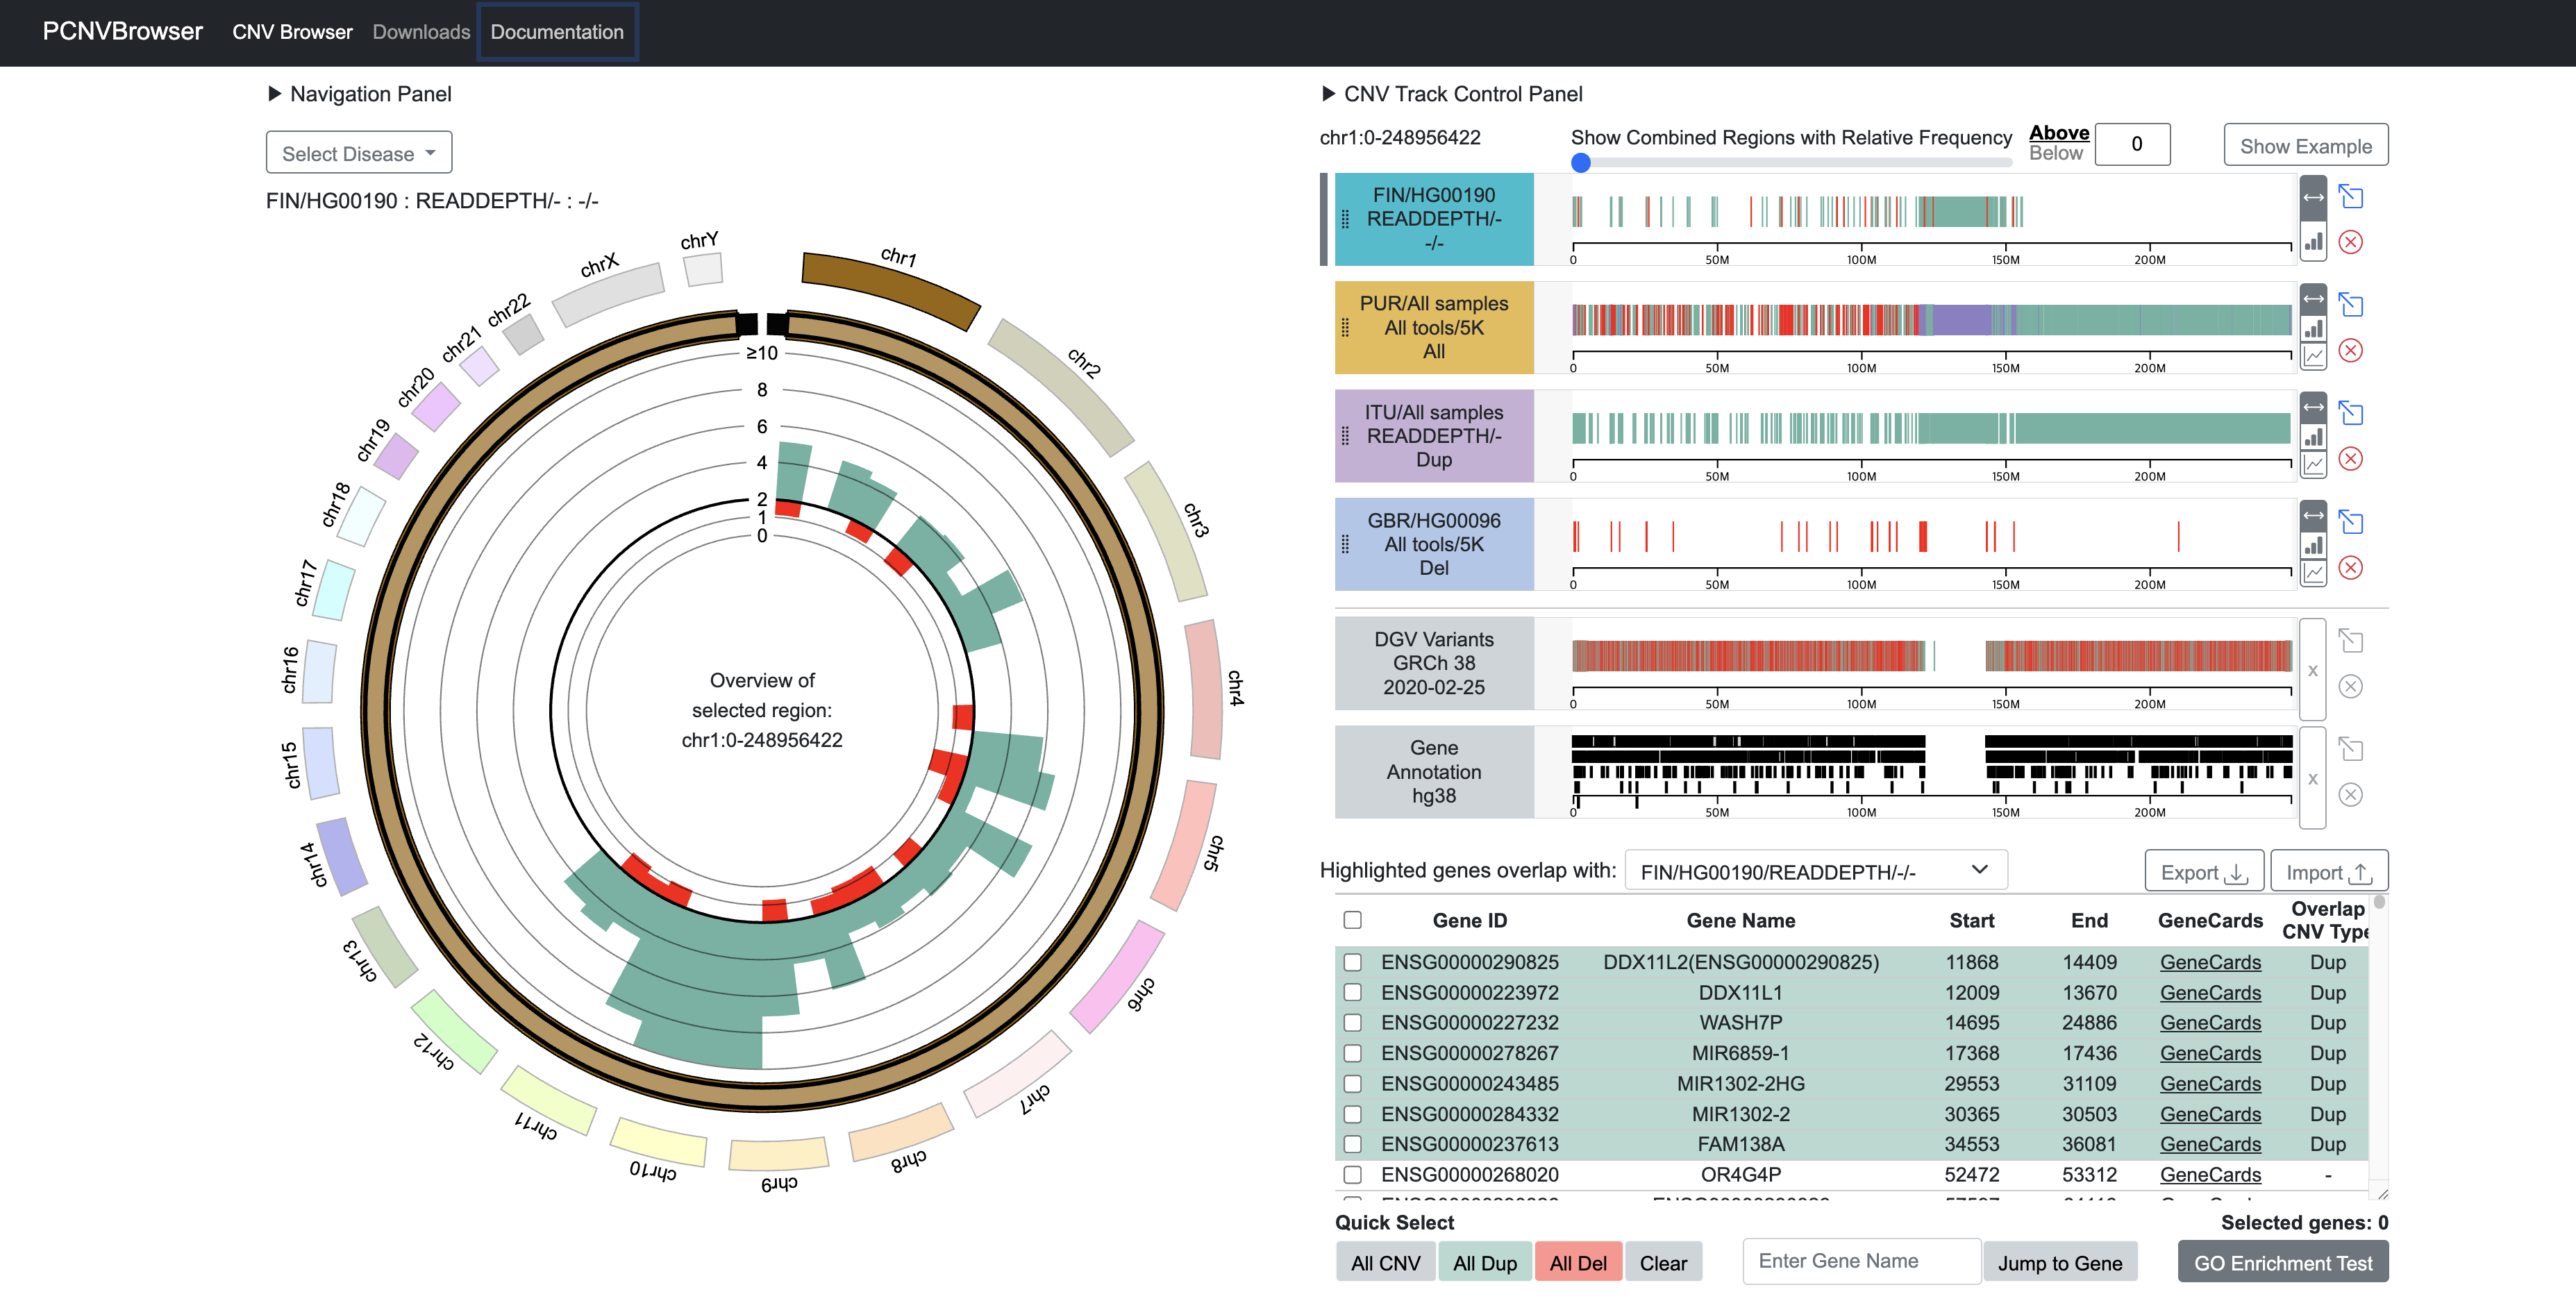
- PCNVBrowser is a comprehensive web-based application for the analysis and visualization of copy number variations (CNVs).
- Built upon data derived from the 1000 Genomes Project[1] Phase 3 dataset, PCNVBrowser enables researchers and clinicians to explore, analyze, and interpret CNVs across diverse populations and genomic contexts.
- The platform provides belows, offering an intuitive way to navigate and study CNVs in different samples and populations.
- (i) CNVs identified by various tools and their combinations from multiple perspectives
- (ii) a user-friendly interface to browse genome-wide CNVs
2. Visualization
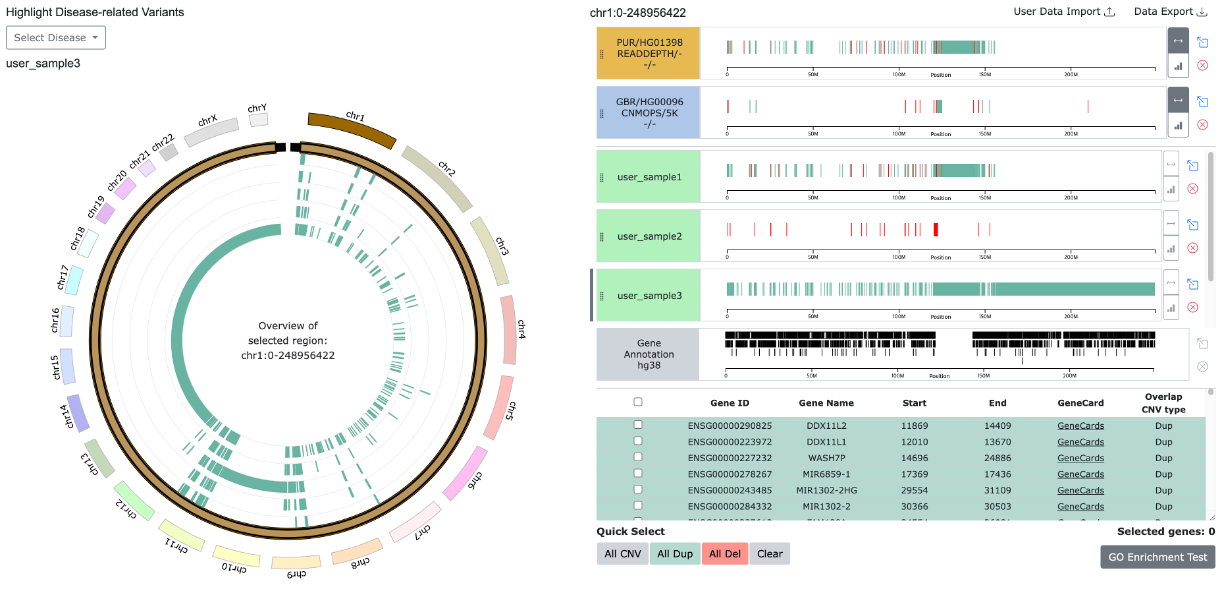
2-1. Circular View for Single-sample CNV
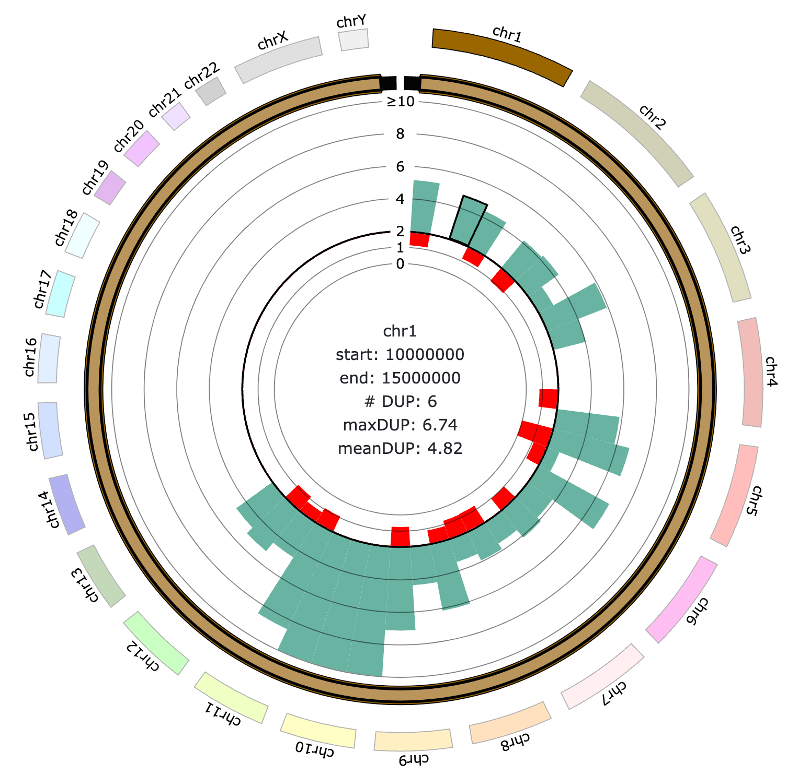
- Displays a circular bar plot showing the average copy number of CNVs within Target Windows for each chromosome.
- For evenly binned regions, the bar plot represents the average copy number height separately for duplications and deletions.
- Smaller Target Window size allows higher-resolution CNV plots.
- Hovering over a CNV displays detailed bin information, including the number of CNVs within the bin, as well as the mean and maximum copy number.
2-2. Circular View for Integrated CNVR
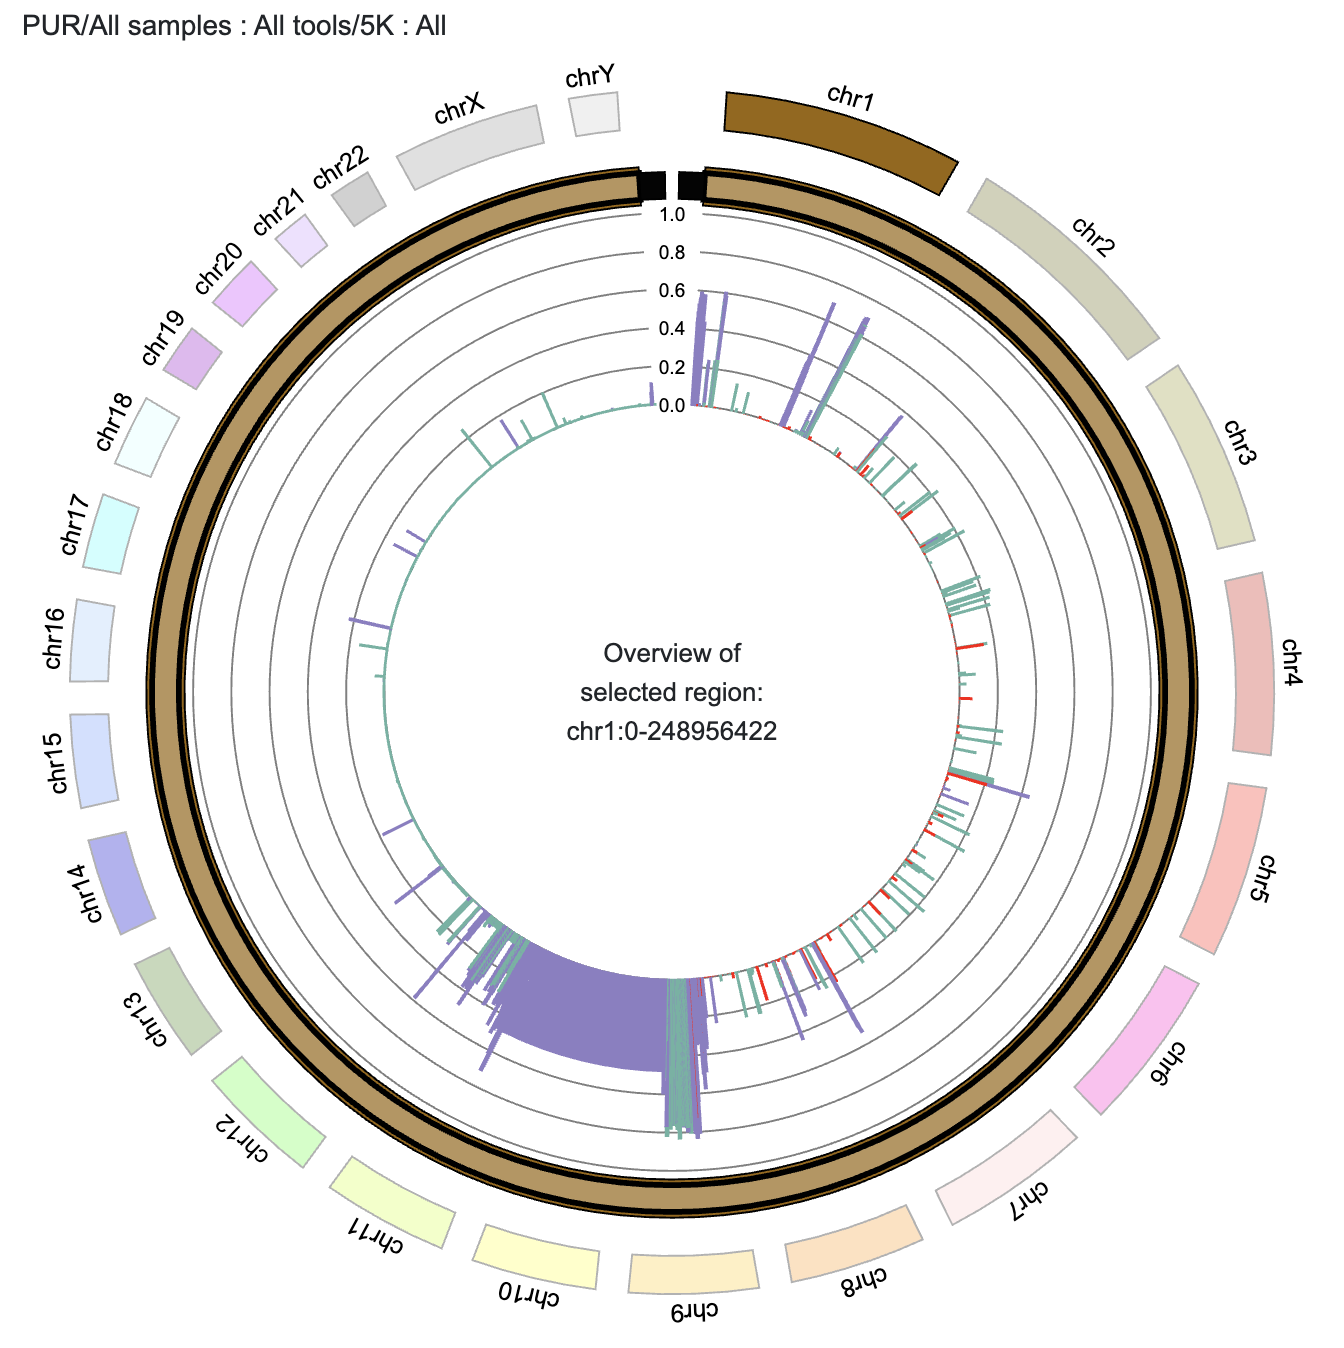
- Integrated CNVRs are visualized as intervals, with bar height indicating their frequency.
- Hovering over a Integrated CNVR displays detailed interval information.
2-3. Linear Track View for Single-sample CNV
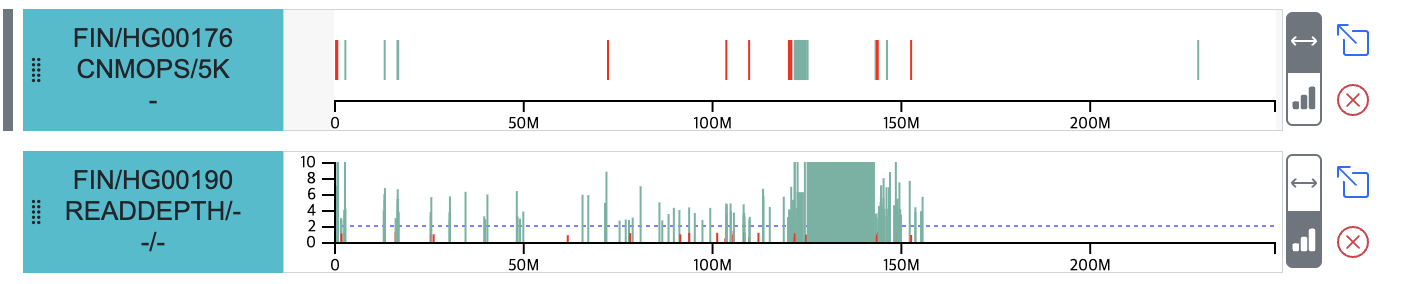
- Displays a linear view of single-sample CNVs for the region indicated by the Target window in the Circular view.
- By default, intervals are color-coded by variant type (duplication: green, deletion: red).
- Provides a view to display copy number data, allowing visual inspection of the copy number for each CNV in the region.
- The (x) button allows you to remove the track from the webpage.
- The (arrow box) button allows you to view the track's data in the Circular view.
- Linear tracks selected and displayed on the Circular view are marked with a (gray line) indicator on the left side.
2-4. Linear Track View for Integrated CNVR
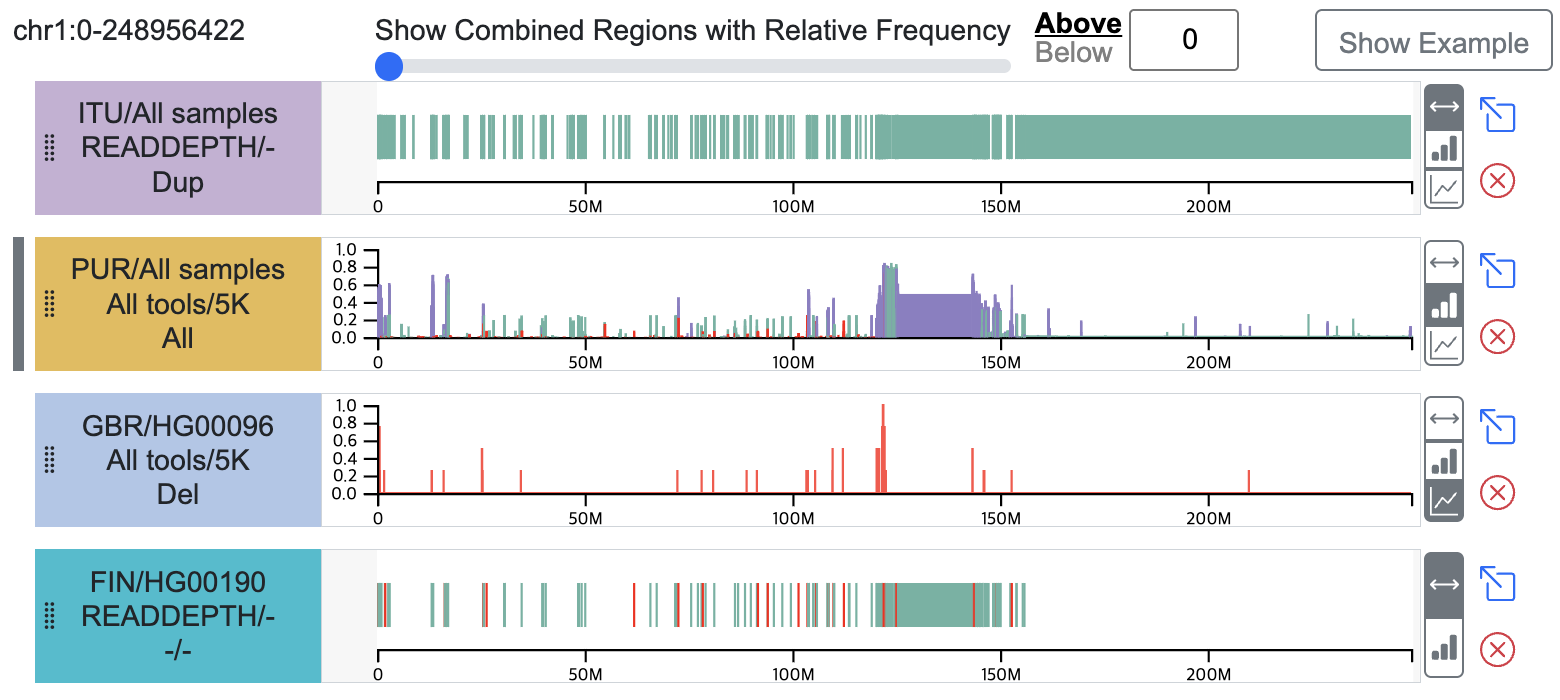
- Provides a linear track visualization of Integrated CNVR data from multiple samples.
- By default, intervals are visualized.
- Additionally, LinePlot and BarPlot views are available, displaying the frequency proportion (a value between 0 and 1) on the y-axis, representing the number of samples contributing to each Integrated CNVR interval.
- The (x) button allows you to remove the track from the webpage.
- The (arrow box) button allows you to view the track's data in the Circular view.
- Linear tracks selected and displayed on the Circular view are marked with a (gray line) indicator on the left side.
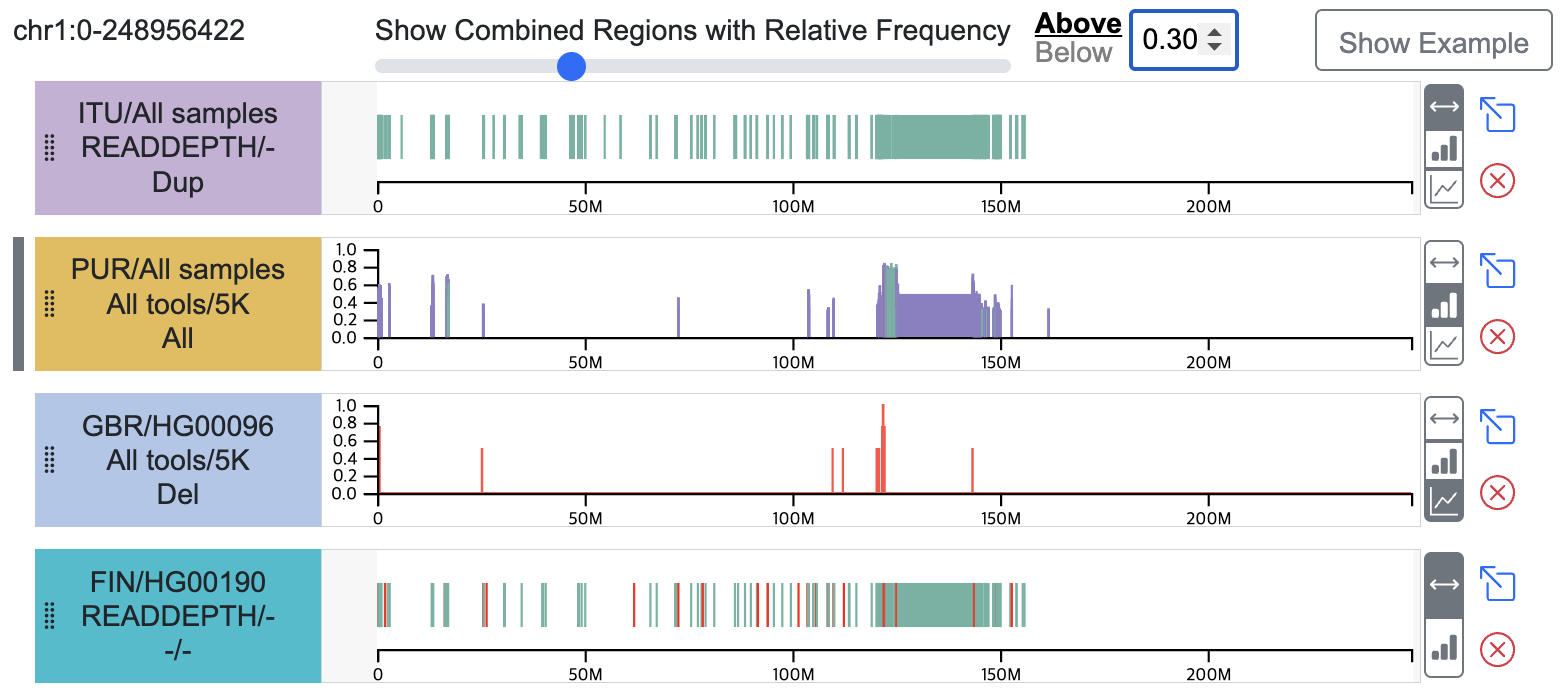
- Users can filter integrated CNVRs by setting a relative frequency threshold using "Above" or "Below" options. This threshold-based filtering is dynamically synchronized with the Circular View.
3. CNV Track Management
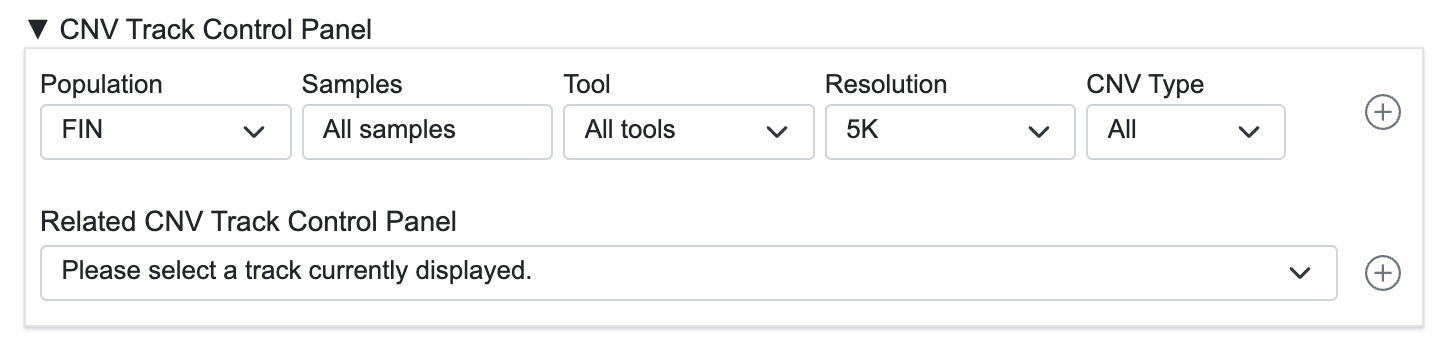
3-1. CNV Track Control Panel
- Provides a flexible interface for adding a new CNV track.
- Quickly add related data tracks by selecting a loaded data set.
- Single-sample Data: Displays Integrated data derived from the selected sample.
- Integrated Data: Displays individual data samples used to generate the Integrated data.
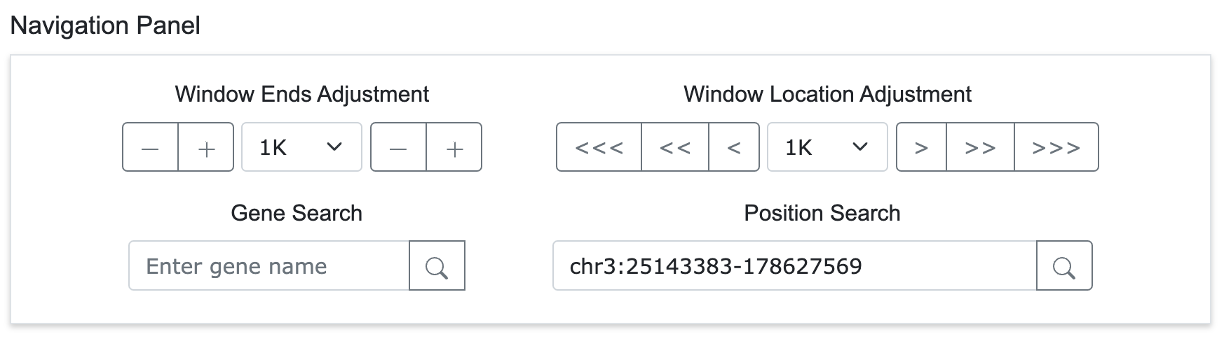
Within the Circular view, a Target Window is positioned above the arc representing a single chromosome. By default, users can adjust the endpoints of the Target Window with the mouse or move the entire window. The Navigation Panel provides various functions for identifying and analyzing specific genomic regions of interest.
4-1. Window Ends Adjustment
- Allows users to adjust the start and end positions of the Target Window by a specified unit.
- Clicking the button on the right changes the right end position of the Target Window on the screen.
4-2. Window Location Adjustment
- Enables users to move the entire Target Window left or right by a specified unit. The ">" button moves the window by 1 unit, ">>" by 2 units, and ">>>" by 3 units.
4-3. Gene Search
- Users can quickly navigate to a specific genomic region by searching for a gene name or inputting a chromosome and coordinate.
4-4. Position Search
- Users can directly navigate to a specific genomic location by entering a chromosome and a base pair position.
5. Gene Annotation
5-1. Gene Table
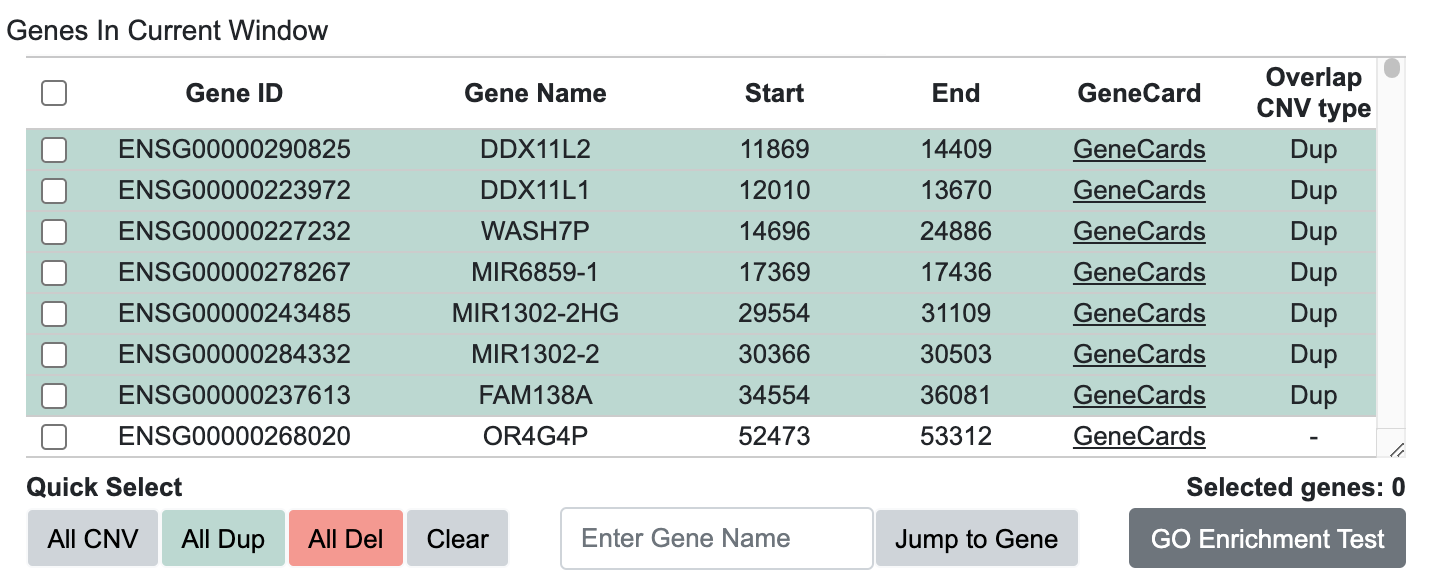
- Displays a list of genes that overlap with the Target Window.
- Provides detailed information about each gene through links to a GeneCards Database[2].
- Indicates which genes overlap with CNVs visualized in the Circular view.
- The "Enter Gene Name" field allows users to search for a specific gene and utilize it for GSEA analysis.
5-2. Quick Select and GO Enrichment Test
- Allows for quick selection of genes that overlap with CNVs in the visualized data.
- Displays the number of selected genes.
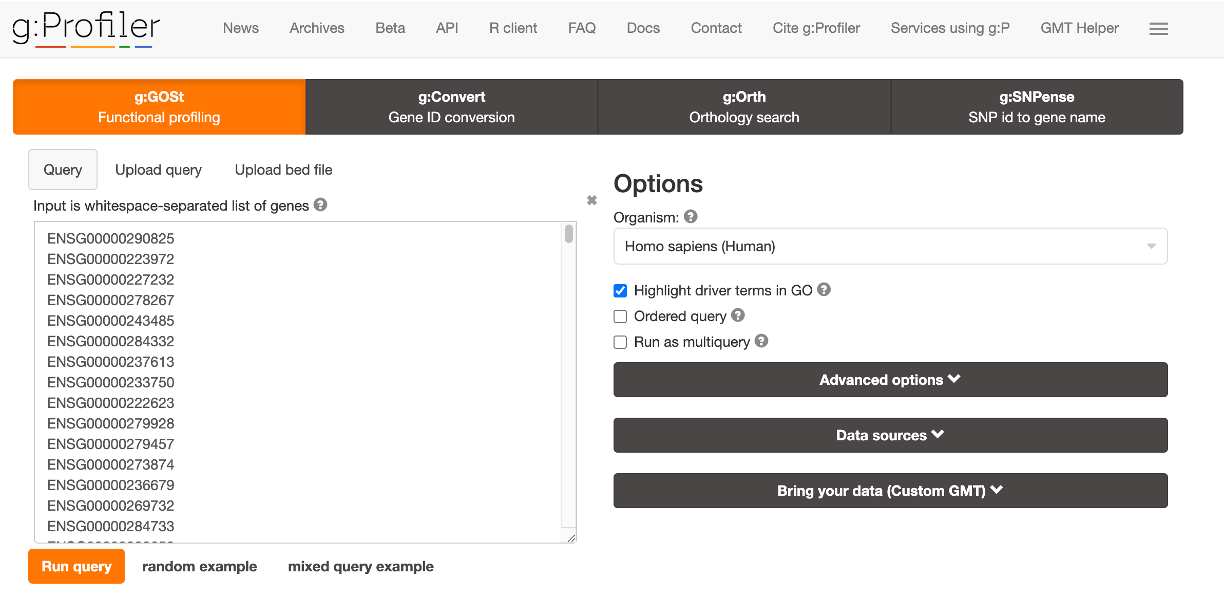
- “GO Enrichment Test” button enables GO enrichment analysis of selected gene lists using g:Profiler[3].
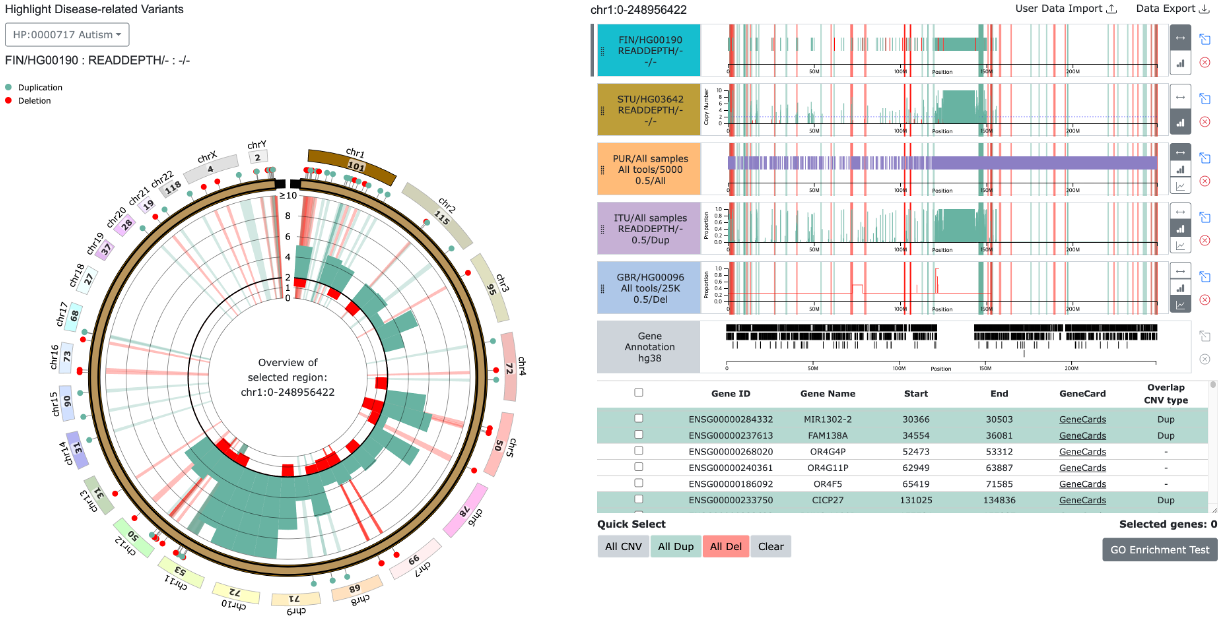
6. Highlight Disease-Related Variants
6-1. Select Diseases
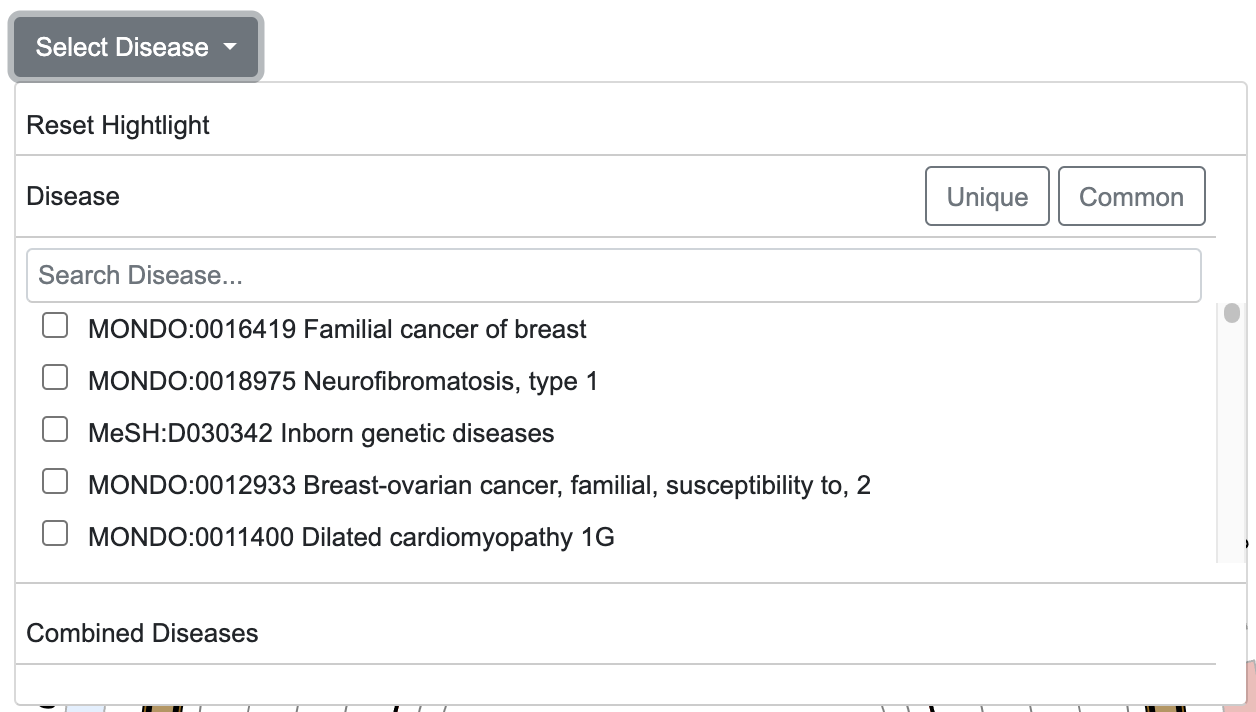
- Enables highlighting of disease-related CNV data obtained from ClinVar[4] on the Circular view and linear track.
- “Reset Highlight” button resets the highlight view
- "Search Diseases" input field allows users to quickly find diseases by entering the desired disease name
6-2. Diseases Common / Unique Variants
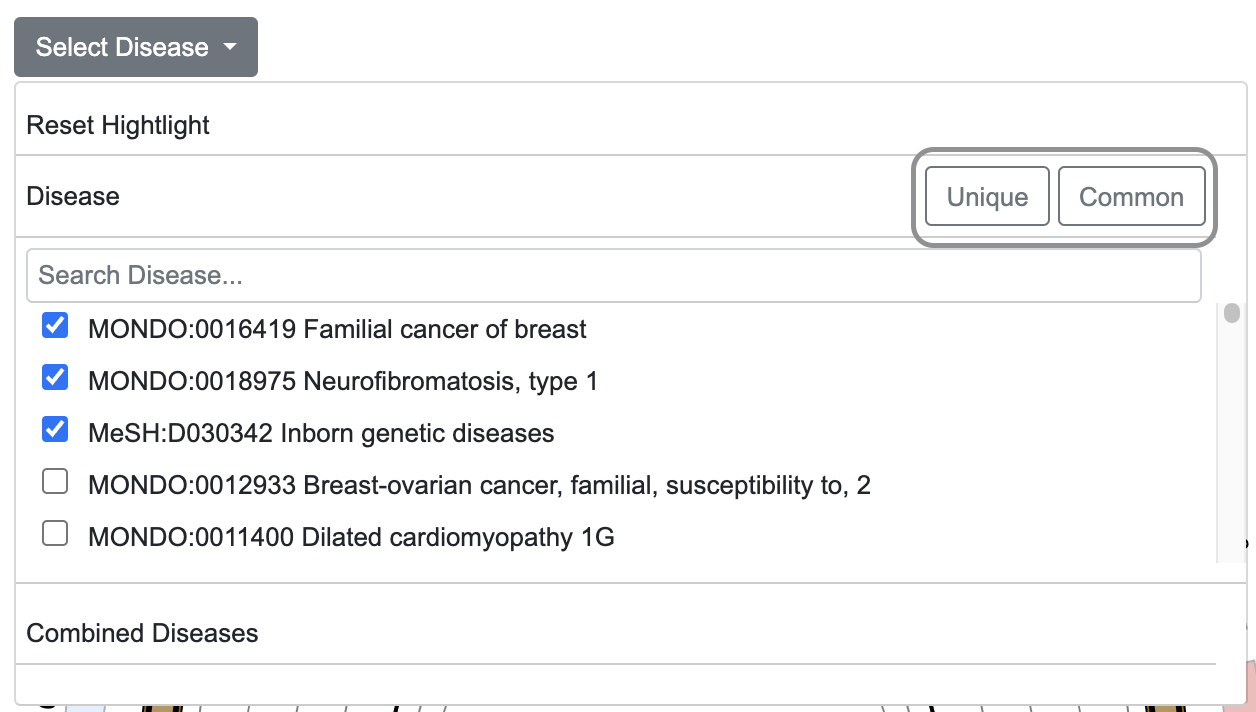
- Using the "Common" and "Unique" buttons, allows users to highlight CNV regions shared among selected diseases or those unique to individual diseases.
- Clicking the "Unique" or "Common" button generates collections of unique or common CNV regions (based on intersections between disease-related CNVs), which are then listed under "Combined Diseases."
Examples: Diseases-related CNV highlight
(1) Single Diseases-related CNV highlight
(2) Common variant from multiple diseases related variants
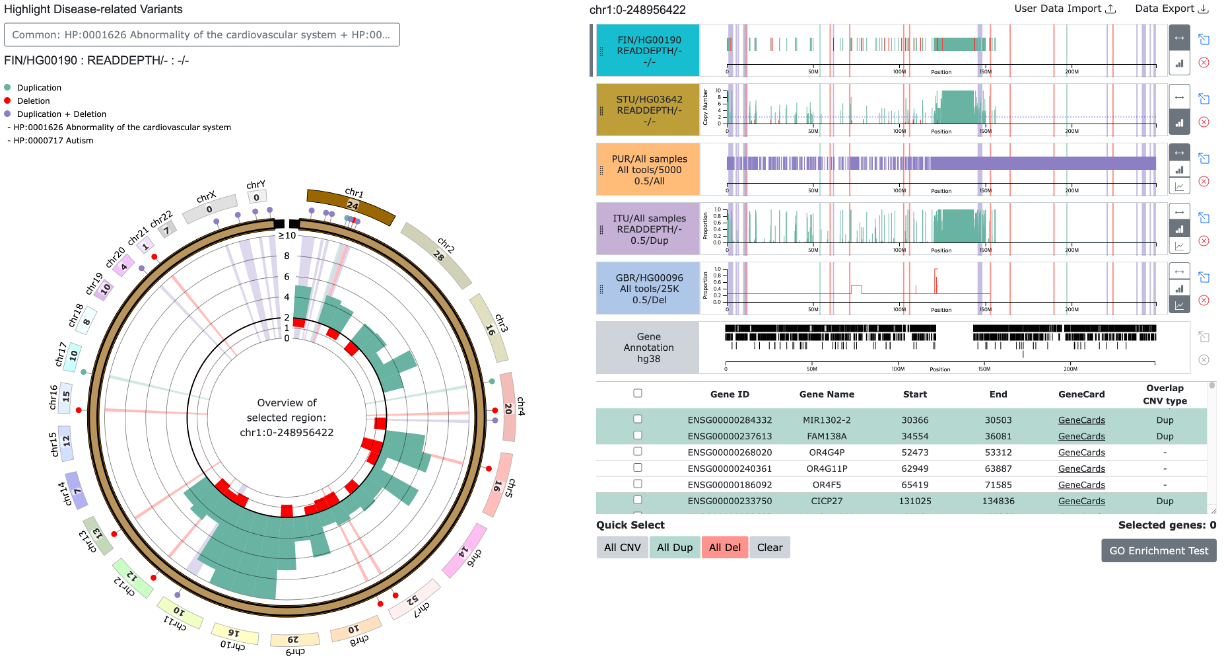
- For selected diseases, common duplication regions are marked with green pins, common deletion regions with red pins, and regions with mixed variants (duplications/deletions) with purple pins. The corresponding regions are highlighted with the same colors in the background.
(3) Unique variants from multiple diseases related variants
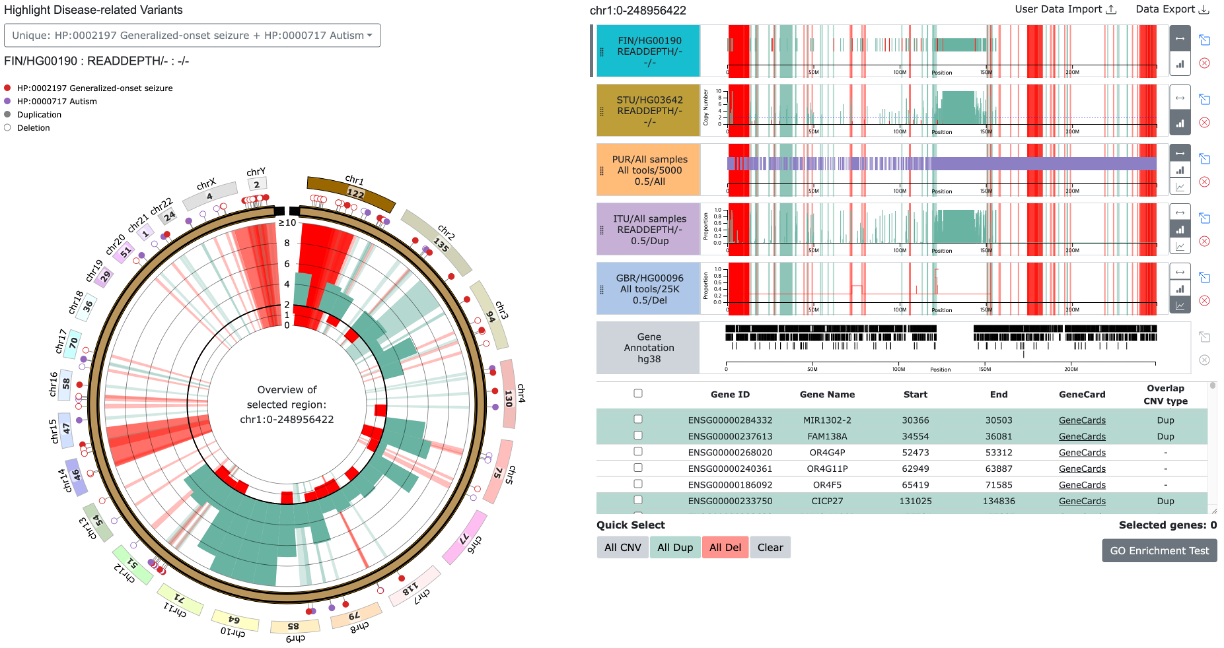
- Pins with different colors represent different diseases.
- Duplications are displayed as filled circles, while deletions are shown as hollow circles.
7. Import / Export Data
7-1. Import User Data
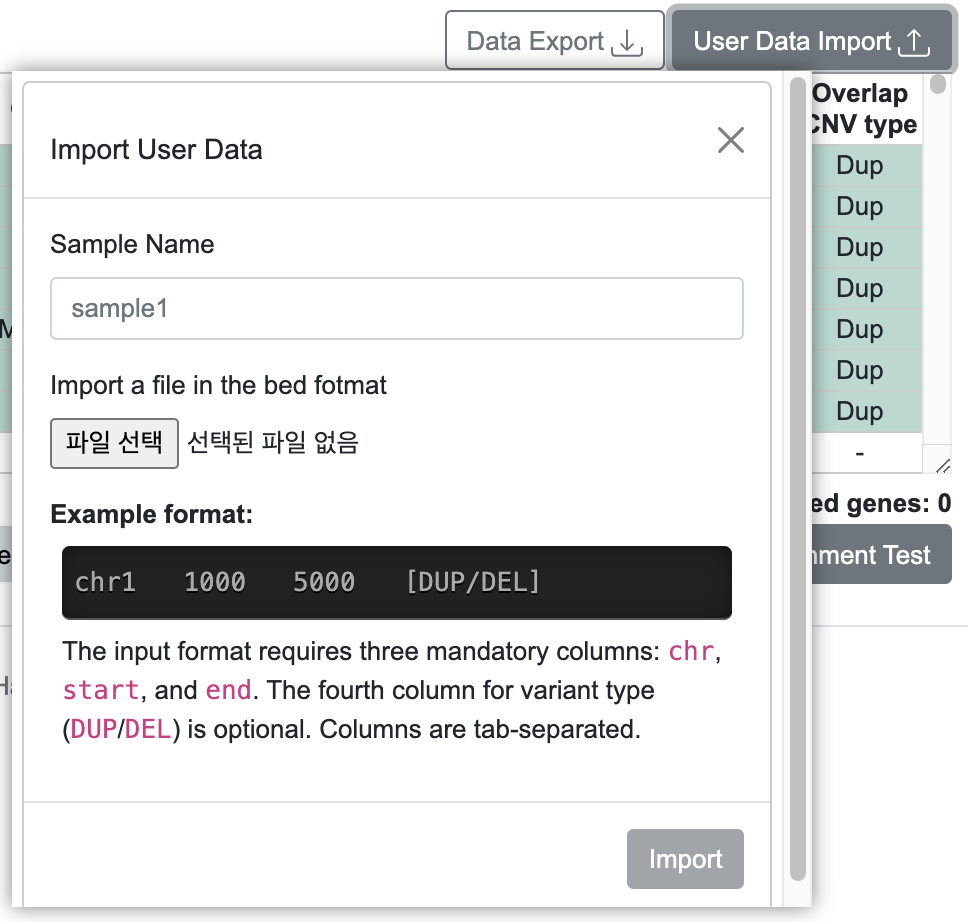
- Accepts an interval file with four tab-separated columns: Chromosome, Start, End, and Variant Type, which can be uploaded as a new track in PCNVBrowser.
- User data can be visualized in the circular view based on intervals.
Example: Import User Data and Visualization
7-2. Export PCNVBrowser Data
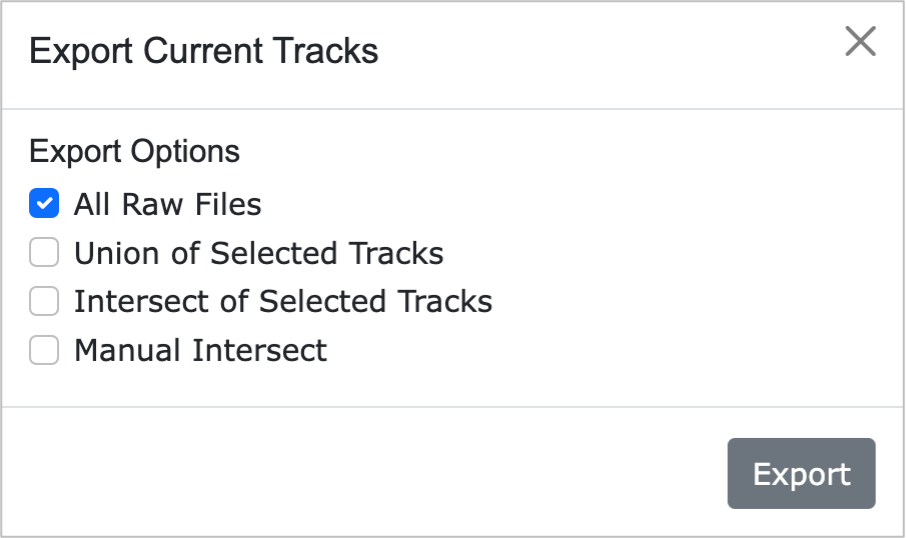
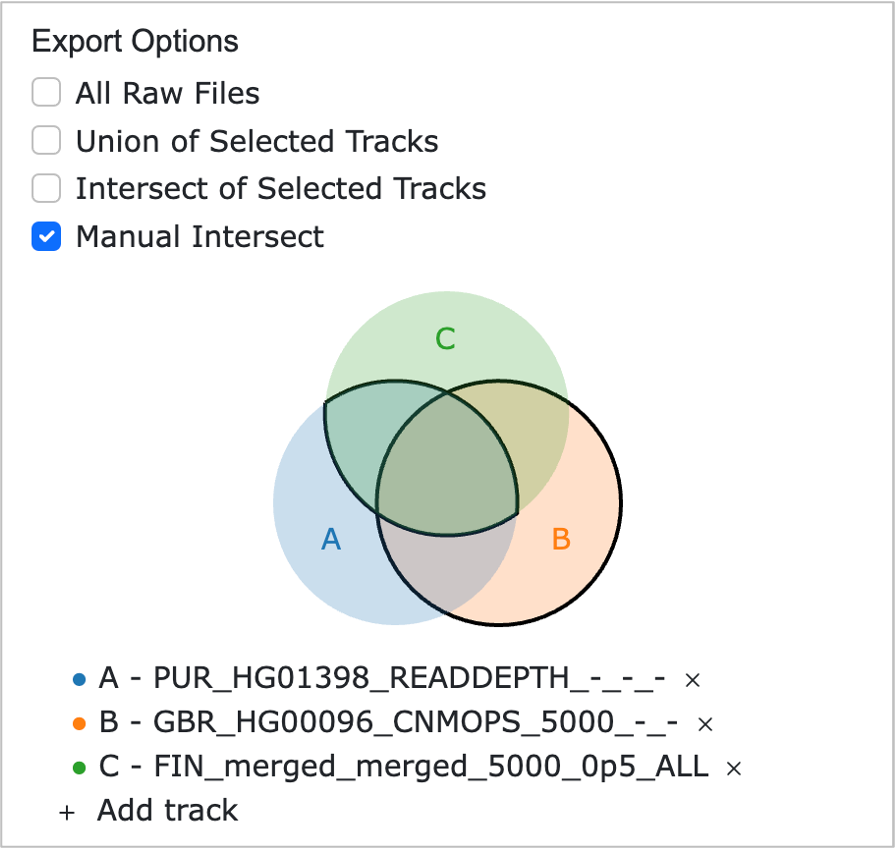
- All Raw Files: Provides all data currently displayed as linear tracks on the webpage.
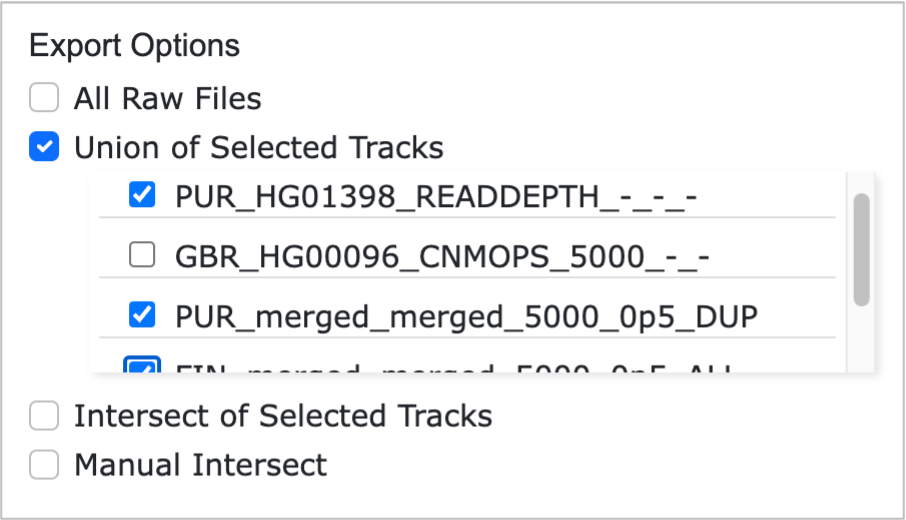
- Union of Selected Tracks: Allows users to select specific tracks from the linear tracks displayed on the webpage and performs a union of all selected tracks, generating the combined result.
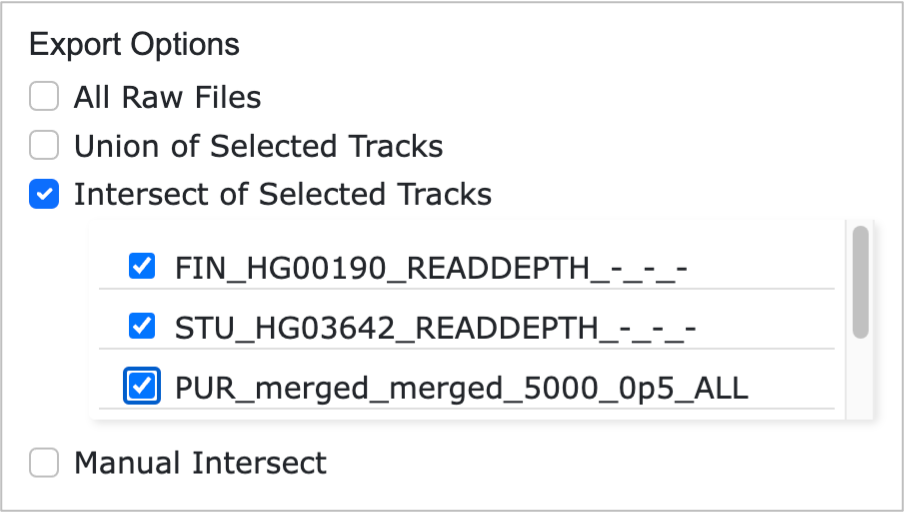
- Intersect of Selected Tracks: Enables users to select specific tracks from the linear tracks displayed on the webpage and generates the result of BEDTools Intersect[5] across all selected tracks.
- Manual Intersect: Allows users to select specific tracks from the linear tracks displayed on the webpage and manually create intersect results between the selected tracks based on user-defined criteria. Differences between selected sets are also automatically computed
8. References
- [1] Susan Fairley, Ernesto Lowy-Gallego, Emily Perry, Paul Flicek, The International Genome Sample Resource (IGSR) collection of open human genomic variation resources, Nucleic Acids Research, Volume 48, Issue D1, 08 January 2020, Pages D941–D947, https://doi.org/10.1093/nar/gkz836
- [2] Stelzer, Gil, et al. The GeneCards suite: from gene data mining to disease genome sequence analyses. Current protocols in bioinformatics 54.1 (2016): 1-30, https://doi.org/10.1002/cpbi.5
- [3] Jüri Reimand, Tambet Arak, Priit Adler, Liis Kolberg, Sulev Reisberg, Hedi Peterson, Jaak Vilo, g:Profiler—a web server for functional interpretation of gene lists (2016 update), Nucleic Acids Research, Volume 44, Issue W1, 8 July 2016, Pages W83–W89, https://doi.org/10.1093/nar/gkw199
- [4] Landrum MJ, Lee JM, Riley GR, Jang W, Rubinstein WS, Church DM, Maglott DR. ClinVar: public archive of relationships among sequence variation and human phenotype. Nucleic Acids Res. 2014 Jan 1;42(1):D980-5. , https://doi.org/10.1093/nar/gkt1113
- [5] Aaron R. Quinlan, Ira M. Hall, BEDTools: a flexible suite of utilities for comparing genomic features, Bioinformatics, Volume 26, Issue 6, March 2010, Pages 841–842, https://doi.org/10.1093/bioinformatics/btq033
9. Contact / Support
- Contact
- Intelligent Bioinformatics Computing Laboratory, Konkuk University.